⭐️⭐️⭐️⭐️⭐️
Optimize your operations with unique data points.
A crystal ball at your fingertips, all based on data.
Benefit from pre-made or custom reports based on multiple data sources.
Schedule automated updates to save time and make data-driven decisions.
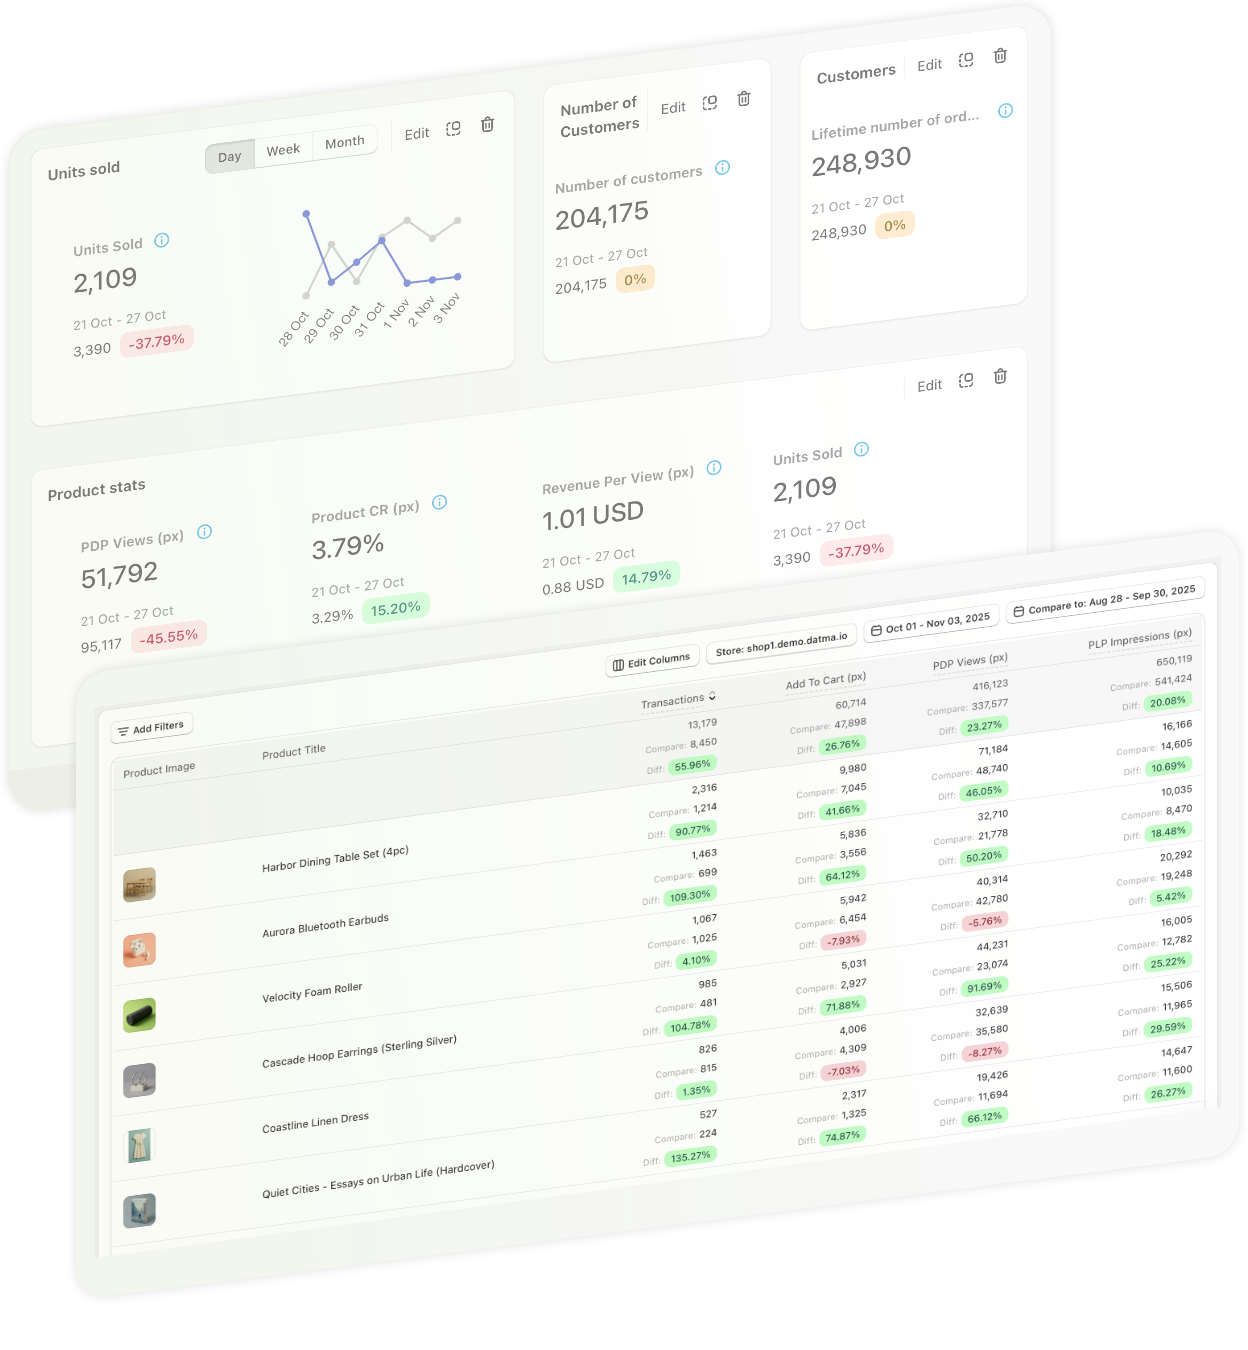
Gain a competitive edge with exclusive data on product views, impressions, and revenue.
Easily export data to Excel for streamlined collaboration and informed decision-making.
Install from the Shopify App Store.
2 years of historical data.
Uncover actionable insights.
Seamlessly Streamline Your Data Analysis: Don't just collect data - uncover actionable insights to power your business growth. Simplify your workflow, empower your decision-making, and unlock your full store's potential.
Datma | Shopify | GA Universal | |
Forecasting | ✅ | ❌ | ❌ |
ChatGPT like interrogations | ✅ | ❌ | ❌ |
Product views and impressions | ✅ | ❌ | ✅* |
Collection attributed revenue | ✅ | ❌ | ✅* |
Price Range and change analysis | ✅ | ❌ | ❌ |
Combining session with backend data | ✅ | ❌ | ❌ |
Product Performance | ✅ | ❌ | ❌ |
Session | ✅ | ✅ | ✅ |
Customers, Orders, Finance | ✅ | ❌ | ✅ |
Custom reports | ✅ | ✅ | ✅ |
Scheduled reports | ✅ | ✅ | ✅ |
Unlimited data exports | ✅ | ✅ | ✅ |
Align your prices with your customers' expectations with Price Range and Price Change analysis
Instant view of how your products are performing day by day, week by week, or month by month.
Product | SV 2 | SV 7 | SV 15 | SV 30 |
3 | 1.56 | 1.21 | 1.74 | |
0 | 0.3 | 0.9 | 1.12 | |
3 | 1.56 | 1.21 | 0.8 |
Instant view of how your products are performing day by day, week by week, or month by month.
Product | Jan | Feb | Mar | Apr | May | Jun |
+33% | +28% | +22% | +18% | +13% | +7% | |
+12% | +7% | +3% | -1% | +2% | -5% |
'Hidden products', 'Viewed, not purchased', 'Listed, not clicked', 'A products', 'B products', and 'C products'.
Products. Product Types. Vendors.
PRD. 1 | PRD. 2 | Shared | % of 1 | % of 2 |
2,341 | 12% | 5.4% | ||
2,341 | 12% | 5.4% |
Our platform provides you with valuable insights into your collections that can help you drive growth and maximize revenue. By understanding how many times customers browse a collection, which products get the most clicks, and which collections generate the most revenue, you can optimize your offerings to better meet customer needs and preferences.
Collection | Collection Views | Collection CTR | Collection CR | Collection Revenue |
On Sale | 2,234,123 | 0% | 0% | 0% |
T-shirts | 2,456,345 | 0.02% | 0.02% | 0.02% |
Boots | 2,456,345 | 0.14% | 0.14% | 0.14% |
Easily see which campaigns are driving the most revenue, and which ones are not performing as well as you'd like.
Ad Platform | Costs | revenue | roas |
Google Ads | $132,234 | $290,915 | 2.2 |
Facebook Ads | $84,319 | $151,774 | 1.8 |
Understand how customers interact with your products, which gather attention, which waste precious real-estate.
SKU | PDP Views | PDP CR | PLP Impressions | PLP CTR |
123456 | 2,456,345 | 14% | 14,234,543 | 8% |
234342 | 2,456,345 | 24% | 14,234,543 | 12% |
Easily understandable and user-friendly web analytics.
Datma is not (yet) affected by ad blockers.
There's no sampling. We report every session.
Week 1 | Week 2 | Week 3 | Week 4 | Week 5 | |
Product Revenue | 225,084.99 USD | 353,254.82 USD | 375,104.91 USD | 416,415.11 USD | 254,686.60 USD |
Refunds | -6,633.61 USD | -10,226.95 USD | -11,428.51 USD | -10,477.09 USD | -6,682.09 USD |
Discounts | -1,851.76 USD | -2,061.62 USD | -2,930.57 USD | -4,560.51 USD | -2,395.76 USD |
Shipping | 37,334.09 USD | 56,782.51 USD | 55,873.82 USD | 61,070.76 USD | 37,135.28 USD |
Net Sales | 253,933.71 USD | 397,748.76 USD | 416,619.65 USD | 462,448.27 USD | 282,744.03 USD |
Refund COGS | 14,543.23 USD | 18,153.24 USD | 13,539.84 USD | 15,964.31 USD | 17,413.20 USD |
COGS | -134,543.23 USD | -118,153.24 USD | -143,539.84 USD | -185,964.31 USD | -157,413.20 USD |
Google Ads | -31,355.74 USD | -44,245.35 USD | -39,754.84 USD | -54,163.24 USD | -33,714.69 USD |
Facebook Ads | -6,387.49 USD | -61,644.69 USD | -114,514 USD | -78,635.78 USD | -32,016,88 USD |
Marketing Costs | -37,743.23 USD | -105,890.04 USD | -154,268.84 USD | -132,799.02 USD | -65,731.57 USD |
Gross Profit |
One-click integrations with Google Ads and Facebook ads.
Customers that have placed only one order.
Customers that haven't placed an order in a long time.
Customers with high-value orders.
Analyze your customer acquisition and behavior with ease.
Datma is tested with all major themes. If you encounter a problem, please do contact us! We are more than happy to help.
No. Our tests have shown a below 10ms load time of our script. That's fast.
In general, yes. Datma only reads the interactions between your clients and your store. It doesn't interfere with the inner workings. There may be exceptions as some apps take more creative approaches to solve problems, approaches that we can't possibly know or cover beforehand. If you have doubts or encounter any issues, please do let us know.
One-click install and everything works out of the box.
Yes, it is. Datma is built in Europe with a lot of effort and care dedicated to protecting your data. And yes, it is your data.
⭐️⭐️⭐️⭐️⭐️
The Dude's Threads
⭐️⭐️⭐️⭐️⭐️
Játszma
⭐️⭐️⭐️⭐️⭐️
Jocozaur
⭐️⭐️⭐️⭐️⭐️
CosmeticPlant
⭐️⭐️⭐️⭐️⭐️
Jocozaur
© 2023 Datma
Alcor SRL | J52/267/15.07.2003