32 Questions Answered by Datma's Analytics
How Are My Products Converting?
Gain a holistic understanding of the conversion funnel's effectiveness with the help of product views, add-to-cart, and units sold measures, which work together to illustrate the entire journey from initial interest to successful conversion.
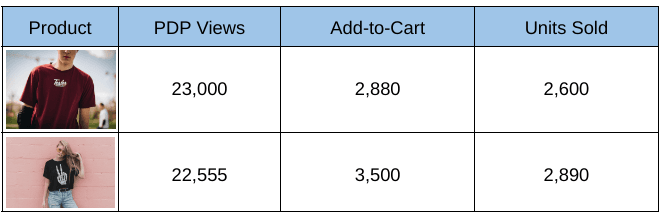
Product Views help you understand product visibility and appeal. In practice, such data can be used to strategically optimize marketing efforts and enhance product visibility based on popularity.
Add-to-Cart measures represent a critical point where customer intent transitions into action. You can use this data to guide strategic improvements in the user experience and overall conversion funnel efficiency.
Units Sold quantify successful conversions. They help to assess conversion funnel effectiveness, identify high-performing products, and optimize inventory and marketing strategies.
Utilizing this data enables you to facilitate a smooth transition from discovering products to completing successful conversions, thereby guaranteeing increased customer involvement and continued success in e-commerce.
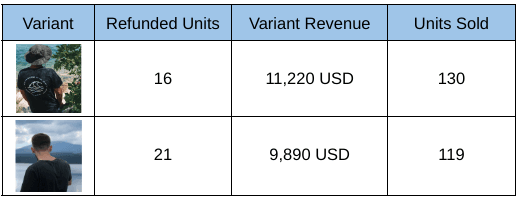
What’s My Sales & Refunds Dynamic?
Pairing the examination of units sold and refunded units offers a strategic and quick method for understanding and improving product-specific performance.
- Understanding key aspects of product performance
Units sold provide a quantitative measure of success and popularity, while refunded units offer insights into customer dissatisfaction.
By analyzing both metrics side by side, you gain a holistic view of product performance, identifying successful products and addressing customer concerns simultaneously.
- Inventory Management
Units sold guide inventory decisions based on product popularity, while refunded units signal potential quality or customer satisfaction issues.
This dual approach aids in strategic inventory management, ensuring the availability of popular products and addressing quality concerns promptly.
- Proactive Customer Satisfaction Enhancement
Refunded units highlight areas for improvement in product descriptions, quality assurance, or meeting customer expectations.
You can proactively enhance customer satisfaction by addressing identified pain points, refining marketing strategies, and continuously optimizing the product offering.
So, the combined analysis of units sold and refunded units provides a strategic advantage.
This approach not only unveils a comprehensive picture of product performance but also guides you in making informed decisions for strategic inventory management and proactive customer satisfaction enhancement.
How Much Inventory Do I Need?
The trio formed of units sold, product views, and inventory quantity acts as a powerhouse for effective inventory management.
Units sold provide a direct measure of product demand and popularity, enabling businesses to identify top-performing items and adjust inventory levels accordingly.
Simultaneously, product views serve as a leading indicator of customer interest, helping forecast potential demand trends and influencing inventory stocking decisions.
The inclusion of inventory quantity completes the equation, offering a real-time snapshot of available stock.
This triple-measures approach can be used in:
- Inventory replenishment, by ensuring popular products are consistently available.
- Stockouts or overstock prevention, by considering both current sales trends and customer interest.
Thus, these measures used together empower you to strike a balance between demand and supply. They reduce the risk of stockouts or overstock situations, and ultimately enhance overall operational efficiency.
Are My Customers Coming Back?
Know whether customers return after their first order by using these two measures: Customer Churn after First Purchase and Customer Retention after First Purchase.
Customer Churn after First Purchase represents the number of customers who do not make subsequent purchases after their initial order. This measure highlights areas where customer satisfaction or engagement may be lacking.
Customer Retention after First Purchase represents the number of customers who have placed subsequent orders after their initial product purchase. It reflects the percentage of customers who continue to engage with your products. A high retention indicates effective strategies in nurturing customer loyalty and satisfaction.
Leveraging these measures enables you to tailor marketing campaigns, enhance product offerings, and elevate customer service to meet their needs effectively.
Customer Retention helps you understand what brings customers back. By identifying effective tactics, you can replicate them to drive more growth and reduce churn.
How Long Until the Next Order?
Understand more about your customers’ buying patterns and frequency with these two measures: Average Days to Repurchase and Average Days to Next Order.
Average Days to Repurchase measures the average number of days it takes for a customer to make a repeat purchase of the same product. This measure provides deep insights into customer buying behavior, shedding light on the frequency of repurchases and indicating customer loyalty and satisfaction levels.
Average Days to Next Order represents the average number of days it takes for a customer to place their next order after purchasing a specific product. This measure offers valuable insights into the time it takes for a customer to make any subsequent order after purchasing a particular product, allowing you to estimate customer engagement and the effectiveness of your marketing strategies.
Understanding the Average Days to Repurchase allows you to tailor your strategies to encourage repeat purchases and foster stronger customer loyalty.
Similarly, insights from Average Days to Next Order enable you to optimize your marketing efforts and improve customer retention by ensuring timely engagement with customers after their initial purchase.
How Are My Variants Selling?
Get a quick understanding of how your variants are selling with these three measures: Variant Units Sold, Variant Revenue, and Variant Average Selling Price (ASP).
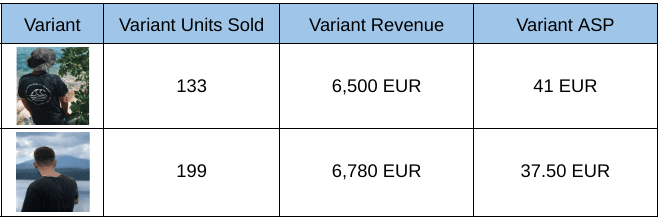
Variant Units Sold quantifies the number of individual product variations sold within a given timeframe. This measure enables you to identify the popularity and demand for specific product variations, aiding in inventory management, identifying top-performing variants, and optimizing marketing efforts to capitalize on consumer preferences.
Variant Revenue measures the total income generated from the sales of different product variants. By tracking revenue at a variant level, you can pinpoint high-value products, allocate resources effectively, and develop targeted pricing strategies to maximize profitability.
Variant Average Selling Price (ASP) calculates the average price at which each product variant is sold. This measure assists you in evaluating pricing strategies, identifying opportunities for upselling or cross-selling, and understanding consumer willingness to pay for different product features or specifications.
How Profitable Are My Variants?
Learn more about the profitability of your variants with these four measures: Discount, COGS (Cost of Goods Sold), Variant Revenue, and Variant Refunded Value.
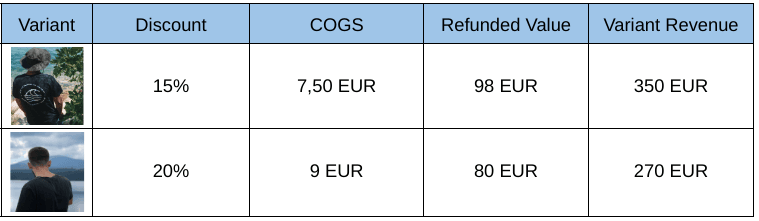
- Discount represents the value of discounts applied to specific product variants during transactions. This data enables you to evaluate the effectiveness of discounting strategies, measure their impact on sales and revenue, and fine-tune promotional activities to attract and retain customers.
- COGS (Cost of Goods Sold) denotes the cost incurred to produce or acquire specific product variants from suppliers. By tracking COGS at a variant level, you can accurately assess profitability, determine pricing strategies, and make informed decisions regarding inventory management and supplier relationships.
- Variant Refunded Value quantifies the monetary value of refunds issued for specific product variants. Tracking this metric enables you to analyze product performance, identify quality issues or customer dissatisfaction, and implement measures to enhance product quality and customer satisfaction.
- Variant Revenue measures the total income generated from the sales of different product variants after accounting for discounts and refunds. This measure provides you with a comprehensive view of revenue streams, aiding in financial planning, performance evaluation, and strategic decision-making.
How Many Variant Refunds Do I Have?
Understand and optimize the returns process and customer satisfaction with the help of these measures: Refunded Units, Refunded Value, and Orders with Refund .
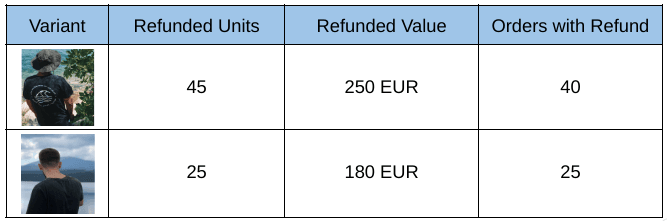
- Refunded Units represent the number of individual product units that have been refunded to customers within a selected time frame. This measure allows you to monitor product returns, identify trends in customer dissatisfaction or product performance, and implement strategies to minimize returns and improve overall product quality.
- Refunded Value quantifies the total monetary value of all product refunds processed within a specified period, excluding any refunded shipping costs. By tracking this measure, you can assess the financial impact of returns, evaluate the effectiveness of return policies, and identify opportunities to streamline the returns process and reduce associated costs.
- Orders with Refund indicate the number of orders that have resulted in at least one product refund during a given time period. This measure offers insights into the frequency of returns within the customer base, enabling you to identify potential areas for improvement in product descriptions, customer service, or shipping and handling processes to reduce returns and enhance customer satisfaction.
How Can I Improve Inventory Management?
Improve your inventory management with these 4 measures: Start Amount (COGS), End Amount (COGS), IN Amount (COGS), and OUT Amount (COGS), where COGS is Cost of Goods Sold.
- Start Amount (COGS) sets the baseline by quantifying the value of inventory at the beginning of a specified time frame. This measure helps you understand your starting inventory position and plan accordingly for the period ahead.
- End Amount (COGS) signifies the value of inventory at the end of the designated time frame. By comparing Start Amount with End Amount, you can assess inventory performance, identify trends, and make informed decisions about replenishment and stock levels.
- IN Amount (COGS) represents the value of inventory added or purchased during the selected time frame. This measure aids in tracking procurement activities, evaluating supplier performance, and optimizing purchasing strategies to ensure efficient inventory replenishment.
- OUT Amount (COGS) reflects the value of inventory subtracted or sold during the specified period. Monitoring this measure enables you to analyze sales trends, assess product performance, and identify areas for improvement in marketing and sales strategies.
With these 4 measures, you can enhance inventory visibility, optimize stock levels, improve supply chain efficiency, and ultimately drive profitability.
How Are My Collections Selling?
Understand how your collections sell by using these 3 measures: overall sales, overall units sold, and overall transactions.
- Overall sales represent the total revenue generated from the sale of all products within a specific collection. This measure offers a comprehensive view of the collection's performance, allowing you to evaluate its popularity, identify top-selling products, and tailor marketing strategies to maximize revenue.
- Overall units sold indicate the total quantity of products sold within the collection during a given period. By tracking this, you can gain insights into product demand, inventory management, and customer preferences, enabling you to optimize stock levels and streamline supply chain operations.
- Overall transactions represent the total number of transactions completed for all products within the collection. This measure helps you gauge customer engagement, evaluate conversion rates, and assess the effectiveness of sales and marketing efforts.
With these measures, you can gain valuable insights into your collection's performance, identify areas for improvement, and implement strategies to enhance sales.
Which Vendors Generate the Most Refunds?
Identifying which vendors generate the most refunds is crucial for understanding their impact on your business. Utilizing performance-related metrics, such as product refund rates, provides valuable insights into the dynamics of your vendor relationships.
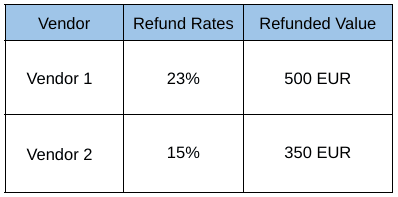
Low refund rates generally signify positive and stable vendor relationships, reflecting a satisfied customer base.
Conversely, high refund rates may indicate potential issues such as concerns about product quality, fulfillment challenges, or dissatisfaction among customers with specific vendors' products or services.
Datma offers a convenient solution to monitor the status and trends of refund rates for each vendor, allowing you to assess their performance on a daily, weekly, or monthly basis.
By keeping this report readily available, you can promptly address any vendor-related issues, ensuring the retention of your customer base and the overall health of your business.
Which Marketing Efforts Drive the Most Sales?
Understanding the marketing efforts that effectively drive sales can be a complex task, often more challenging than assumed.
However, Datma removes this challenge through its UTM tracking report for sold products, providing a clear method to identify what strategies are effective, who is responding, and in what context.
Read more about this in our UTM Tracking: UTM Parameters and Why You Need These Codes article.
Consider this scenario: a customer clicks on an ad, explores your website, and ultimately makes a purchase—a success story on its own. Yet, the question arises: what precisely prompted the purchase?
Datma's "Sold Products by UTM Source" report offers the answer. This tool simplifies the process of tracking which marketing channels, campaigns, or sources play a crucial role in driving sales.
By utilizing this report, you can easily analyze the specific elements contributing to the success of your marketing efforts, enabling you to identify areas for improvement.
How Does A Price Change Affect My Sales?
You have four distinct methods at your disposal to track how a price change affects your sales: individual products, variants, product types, and vendors. These can be measured in terms of revenue, the number of units sold, or gross margin.
With the help of such a report, you can analyze several key aspects:
Demand Elasticity: Price elasticity of demand measures how sensitive the quantity demanded of a product or service is to changes in its price.
This helps you predict how consumers will respond to alterations in pricing.Consumer Behavior: Lowering prices can potentially attract more customers and boost sales volume, while increasing prices may prompt customers to seek alternatives, reduce their purchases, or switch to competing products. The report helps unveil patterns in consumer behavior tied to price fluctuations.
Perceived Value: The price change effect can significantly influence how consumers perceive the value associated with a product or service. Higher prices may be linked to perceptions of higher quality, exclusivity, or prestige, while lower prices might be seen as indicative of discounts or lower quality. The report allows you to explore the impact of price changes on the perceived value of your offerings.
By utilizing these insights, you can make informed decisions regarding pricing strategies and better understand the dynamics influencing your sales performance.
See how the report works by watching our video on YouTube.
Why Are My Products Being Abandoned?
Seeing customers leave their shopping carts without completing a purchase can be disheartening.
To tackle this issue, start by analyzing individual product performance measures to discover the reasons behind abandonment and work towards minimizing it.
With various measures provided by the Products analysis tab you can track and evaluate product types, vendors, sources, refunds, and more.
Bonus
4 strategies to reduce cart abandonment:
- Improve the physical product or its presentation by incorporating high-quality photos, videos, detailed descriptions, and specifications.
- Increase the number of payment types, such as credit cards, online wallets, and various platforms, to provide customers with more choices and increase the likelihood of completing a purchase.
- Minimize the time it takes for customers to reach the checkout by eliminating unnecessary steps or non-mandatory fields. This ensures a seamless and efficient payment process.
- Implement a proactive approach by emailing customers with abandoned carts. Offer incentives such as discounts, alternative product suggestions, or complementary items to encourage them to reconsider and complete their purchase.
Products Viewed but Not Purchased?
Are your products getting a lot of views but not translating into sales?
The "Without Purchases" report aims to answer this question by identifying which products are capturing substantial customer attention without resulting in actual transactions.
Once you've identified the products in question, the next steps involve investigating the obstacles preventing new purchases. Is the pricing fair? Is there a high abandonment rate? Is the product poorly described? By delving into these aspects, you can pinpoint the issues that need addressing to boost sales.
Which Are My Most Visited Products?
To identify the most visited products, utilize the following measures: PDP Views, Product Revenue, PLP Impressions, and Product Conversion Rate.
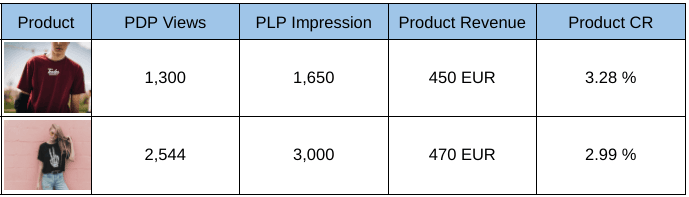
These metrics will provide insights into which products are gaining substantial attention despite not being the primary revenue generators.
These attention-grabbing products present a valuable opportunity for improvement. Since they are already catching the eye of customers and, perhaps, generating some orders, focusing on enhancing these products could lead to increased sales and overall improvement in your store's performance.
How Should I Analyze Refunds?
Wondering how to effectively analyze refunds?
Look no further than the Refunded Products Report, a straightforward tool that helps you understand and manage refunds.
With over 40 available measures, here's a guide on how to utilize them in combination:
- Units Sold & Refunded Units - understand the popularity of products by comparing units sold with refunded units.
- Product Revenue & Refunded Value - map the financial landscape by relating product revenue to the corresponding refunded value, aiding in the assessment of product profitability.
- Transactions & Orders with Refund - establish a correlation between total transactions and those resulting in refunds, revealing patterns in customer behavior.
- Product Margin & COGS (Cost of Goods Sold) - uncover the profitability of products by linking product margin with the cost of goods sold, providing guidance for pricing and inventory decisions.
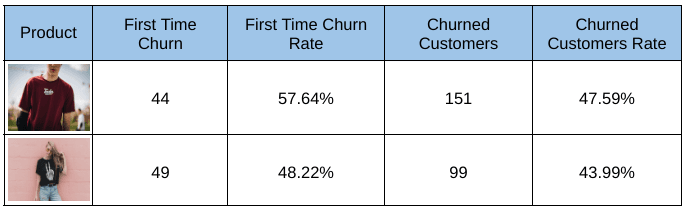
- Churned Customers & Customer Churn Rate - offer a nuanced view of customer retention challenges post-refund.
- PDP View CR (Product Detail Page View Conversion Rate) & PLP Impressions (Product Listing Page Impressions) - provide insights into content and presentation improvements to minimize returns.
- Inventory Management Metrics (Inventory Value, Inventory Quantity, Sell Through Rate) - present an integrated view of inventory dynamics concerning refunded products, facilitating strategic decisions on stock levels and warehouse efficiency.
- Average Selling Price (ASP) & Average Product Price (APP) - compare the average price pre- and post-refund, offering a pricing perspective. Use them together to guide pricing strategies for a balance between competitiveness and sustainability.
- Customer Segmentation Metrics (First Time Churned, First Time Customers Rate) - segregate first-time churned customers and analyze their rate, providing a focused approach to retaining new customers post-refund.
- Revenue per View & Revenue Per Impression - link revenue generation with product visibility through views and impressions. Use them together to shape marketing strategies and optimize product placement for increased revenue.
By leveraging these measures in combination, you can gain comprehensive insights into your refund data and make informed decisions to enhance your business strategies.
Do Product Impressions Matter?
Product Impressions data provides a granular understanding of customer behavior, showing you the products that your customers are looking at the most.
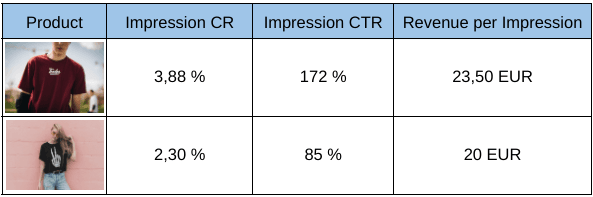
- Product Impressions CR (Conversion Rate) measures the percentage of visitors who make a purchase after viewing a product. This helps you track how effective are your product listings and website experience at turning potential customers into actual buyers.
- Product Impressions CTR (Click-Through Rate) measures the percentage of users who click on a product listing after seeing it. This helps you understand how effective are product visibility and appeal in attracting user interest.
- Revenue per Product Impressions measures the average amount of revenue generated for each product impression. This helps you understand the monetary value associated with each product impression so you can prioritise high-margin products.
Together, these measures go beyond simple visitor counts, providing actionable insights into the effectiveness of product presentation, user engagement, and overall revenue generation.
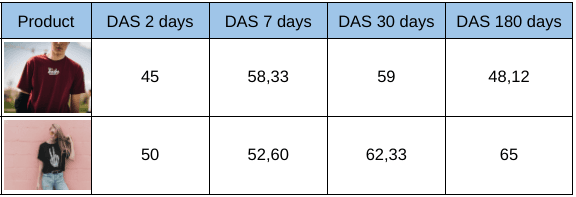
What Are My Daily Average Sales?
DAS, or Daily Average Sales, is calculated by dividing total units sold by the number of days in a specified period.
This allows you to evaluate sales performance on a per-day basis, providing a standardized and comparable measure.
Why you should know your DAS:
- Granular Performance Analysis: such data gives you a peak into both short-term (2 days, 7 days) and long-term (30 days, 180 days) sales performance.
- Trend Identification: it helps you identify sudden spikes or gradual declines, guiding your marketing strategies and inventory planning.
- Performance Benchmarking: it serves as a benchmarking tool for evaluating current performance against historical data, facilitating continuous improvement.
Currently, Datma’s analytics cover 4 dimensions for which you can monitor your DAS: products, variants, product types, and vendors.
How Can I Track Inventory Movements?
Tracking product inventory movements helps you maintain good stock levels, have an accurate demand forecasting, and prevent losses.
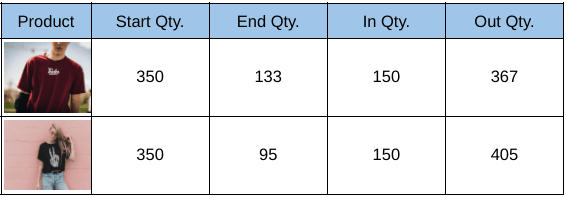
There are 4 main measures which lie at the basis of such report: Start and End quantities, as well as In and Out quantities.
Start Quantity represents the initial count of units at a selected time frame, while End Quanity represents the final count.
- This duo highlights the entire inventory lifecycle, offering a comprehensive view of stock levels from initiation to conclusion.
- These measures help you analyze trends and align inventory with demand.
IN Quantity represents the units that were added to the inventory in a selected time frame, while OUT Quantity represents the units subtracted.
- This duo monitors the dynamic movements of inventory, helping you understand how often products are being sold and how quickly restocking is needed.
- These measures help you optimize your supply chain, and improve ordering processes.
Integrating the above 4 measures into a unified report allows you to allocate resources more efficiently and avoid stockouts or overstock situations.
How Profitable Are My Products?
Understanding product profitability is essential when working towards having a prosperous e-commerce business.
Datma facilitates this understanding by offering three crucial measures at the SKU level: Product Gross Profit, Product Margin, and Product Revenue.
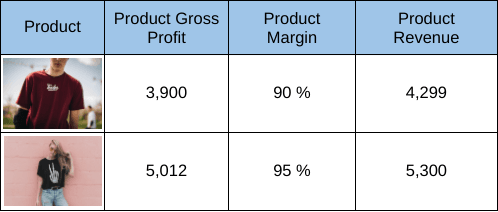
- Product Gross Profit represents the net profit generated by a specific product, factoring in the direct costs associated with production or procurement. Its advantage lies in identifying products that make a substantial contribution to the overall financial health.
- Product Margin, expressed as a percentage, showcases a product's profitability in relation to its revenue. High margins signify efficient conversion of sales to profit, guiding strategic decisions on pricing and marketing.
- Product Revenue represents the total income generated by a product, providing a comprehensive view of sales performance. It helps in understanding the impact of a product on overall revenue, identifying market trends, and optimizing product portfolios.
Together, these measures offer a holistic understanding of SKU-level performance to help you strategically promote, optimize pricing, and manage inventory for a well-rounded approach to maximizing profitability.
Are My Collections Successful?
Continuously evaluating and improving the performance of collections is an ongoing effort for long-term success.
In this process, two important measures stand out: Collection Conversion Rate (Collection CR) and Collection Click-Through Rate (Collection CTR).
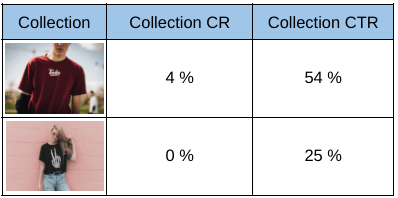
- Collection CR shows how effectively a collection converts views into transactions. It helps you assess a collection's ability to turn potential interest into tangible sales.
- Collection CTR measures the success of promotional strategies. It tells you how well your marketing efforts resonate with the audience, reflecting the level of engagement generated.
The synergy between Collection CR and Collection CTR is crucial. Together, they help identify high-performing collections that not only capture attention (high CTR) but also efficiently convert that interest into transactions (high CR).
This ensures a precise allocation of resources, driving efforts toward collections with the potential for both visibility and financial rewards.
Which Products Make the Best First Impression?
First impressions are often the driving force behind making a purchase decision.
Using the below report will give you a glimpse into which products capture the attention of your customers and convert viewers into buyers.
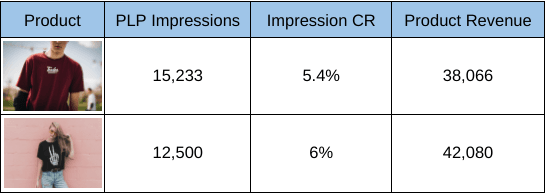
PLP Impressions (Product Listing Page) show the visibility of products across various pages. This helps you examine their online presence and optimize placement strategies in order to improve their visibility and exposure.
Impression CR (Conversion Rate) tells the proportion of purchases that come from these impressions. This highlights which products are best at turning viewers into buyers, guiding strategies for marketing and sales optimization.
Product Revenue helps you assess the individual success of your product offerings by measuring how much they each contribute financially. It informs strategic decisions related to product positioning, pricing, and marketing efforts.
How are these measures working together?
- Products with High PLP Impressions but Low Impressions CR - A cause for concern?
Such a scenario indicates that although many users are viewing your products, they are not proceeding to make a purchase. To improve the CR, consider revising your product listings, offering competitive pricing, and encouraging positive customer reviews.
- Products with Low PLP Impressions but High Impressions CR
This suggests that your products are converting well, but are not being seen by a large audience. To increase your PLP impressions, consider investing in targeted advertising, improving your SEO, or using social media platforms to increase visibility.
- Products with High PLP Impressions and High Impressions CR - The ideal scenario.
This means your products are not only being viewed by a large audience but are also converting well. It is crucial to maintain this momentum by continually updating your product listings, monitoring customer feedback, and staying competitive in the market.
- Products with Low PLP Impressions and Low Impressions CR
This suggests that your products are not reaching a wide audience and are also not converting well. To improve both PLP impressions and CR, it's essential to reassess your marketing strategies, improve product quality, and optimize product listings.
Which Products Attract Customers?
Your revenue gets generated by customers. Without them, your business wouldn’t exist. It's as simple as that.
To discover which products attract and retain customers, you can use a report which includes the following measures. This will help you focus your attention on revenue generating items.
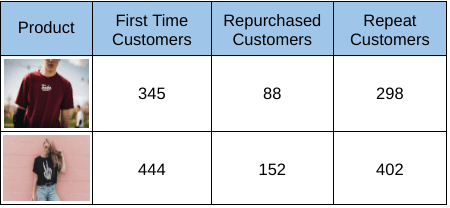
First Time Customers measure shows the number of customers that purchased that specific product in their first order. This tells you which products serve as the entry point for new customers.
Repurchased Customers measure signifies the number of customers who repurchased the same product. This helps you understand customer satisfaction, a higher number reflecting positively on the quality and appeal of the product.
Repeat Customers accounts for the number of customers who made at least one more order after their initial purchase of a particular product, offering a measure of customer loyalty to a specific item. You can focus on retaining these customers by offering incentives, exclusive deals, or personalized recommendations.
Together, these measures provide a comprehensive view of customer interactions with specific products. This data helps improve marketing, understand if customers like your offerings, and make people want to stay loyal to the brand.
How Can I Manage Product Inventory?
Product inventory directly influences your business's ability to meet customer demand, manage cash flow, and optimize operational efficiency.
The report below helps you discover the ins and outs of effective inventory management while equipping you with a clearer understanding of stock dynamics.
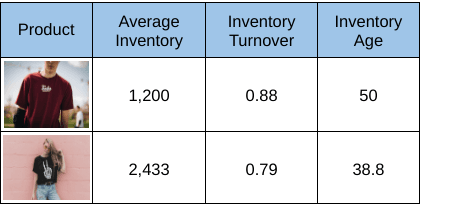
Average Inventory shows how much stock you usually have for each product. This helps you use your resources wisely, making sure you always have just enough products available while avoiding overstock.
Inventory Turnover checks how fast you sell and restock each product. This helps you adjust your sales and buying plans, making sure you always meet customer demand.
Inventory Age reveals how long each product has been in stock. This helps you take action for slow-moving items, knowing when promotions or pricing adjustments are required to increase sales speed and prevent them from becoming outdated .
Together, these measures offer product-centric precision in inventory management to help you make informed decisions, ensuring optimal efficiency and profitability for each product.
Which Products Are Frequently Bought Together?
Curious about your customers' shopping habits? Datma's "Frequently Bought Together" report is your go-to tool. It breaks down the numbers to show you what items often end up in the same shopping cart.
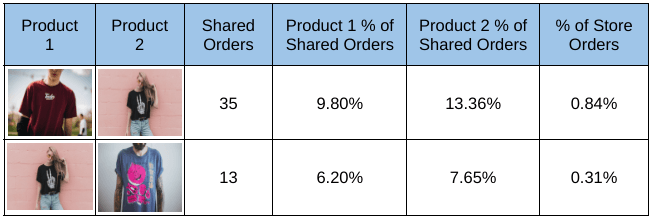
This report has three dimensions: individual products, product types, and vendors, offering information on what your customers prefer to buy together.
What can you do with this data? Bundles.
Pure Bundles: Exclusive combos with items unavailable separately; think cable packages forcing a complete bundle purchase.
New Product Bundling: Pairing a new release with a familiar item for heightened awareness and increased sales.
Cross-Sell Bundling: Offering an additional product to complement the main purchase, often a cheaper item.
Gifting Bundles: Tailored for events, like Valentine's Day, these bundles are perfect for thoughtful gifts.
Inventory Clearance Bundling: Pairing slow-sellers with popular items to create attractive new packages.
The data from this report helps you plan your marketing strategies better. You can suggest combos that make sense, manage your stock efficiently, and place products where they're likely to get noticed.
What is My Customer Churn Rate For Individual Products?
Check How Products Are Doing: Churn rate helps you see if people are sticking with a product or ditching it. High churn? Maybe the product needs a tweak.
Happy Customers, Happy Business: If the churn rate is climbing, it might mean your customers aren't thrilled. This stat helps you keep tabs on their satisfaction.
Know Where Products Stand: Churn rate gives you the lowdown on whether a product is gaining popularity or losing it. Handy for knowing if it's still in the game.
Smart Moves Ahead: Armed with product-specific churn data, you can decide whether to amp up marketing, spruce up the product, or even consider retiring it if it's not cutting it.
Keep Customers Coming Back: High churn? Figure out ways to keep customers interested – be it improving the product, throwing in cool promos, or teaming it up with others.
Churned Customers. These customers have not made another purchase after buying the product. If the product is an expensive “buy once and keep it”, the number of churned customers can be very high, which can be interpreted as good. If the product is cheaper or a consumable, having low churn might be favorable.
First Time Churned. These customers bought a product on their first order and have not made another purchase after. This behavior could be interpreted as a good product for which all customers are here for (although, if it’s the only one, could be a red flag), or a product that drives customers away from your store with either low quality or an unjustifiable price.
Do I Have Forgotten Products?
The "Performance Ratios" report gives a very detailed view of products’ performance on your website, providing information on customer behavior and revenue generation.
The report is divided into six distinct classes, each shedding light on different aspects of client interaction and revenue involvement.
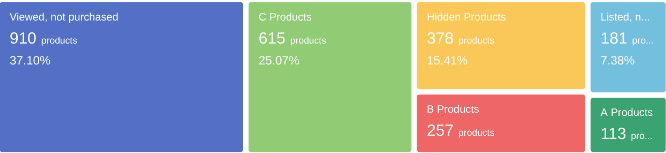
- Hidden Products: The products that have never been viewed by either visitors or recurring customers, remaining undiscovered on the website.
- Viewed, not purchased: This category contains products whose detail pages have been viewed and even added to the cart, yet remain unordered.
- Listed, not clicked: These products have been in view for at least a second or more, either through a collection or search result, but not one user has opened their detail page.
- B Products: Representing products that contribute to the 70 to 90 percent of the cumulative revenue, this category highlights high-performing items.
- C Products: These products make up the bottom 10 percent in terms of revenue contribution.
- A Products: The class of products that collectively generate an impressive 70 percent of the cumulative revenue, showcasing the top-performing items in your inventory.
The report also features a section on cumulative revenue, offering a clear breakdown of individual product revenue alongside the percentage contribution to the total sales.
As a product's revenue percentage increases, it ascends through the classes, signifying its growing impact on overall revenue.
For instance, a product that initially falls into the lower classes can progress, eventually moving from Class C to Class B, and potentially even attaining the coveted Class A status as it garners a higher percentage of the total revenue.
Are My Product Types Performing Well?
Delve into the performance of your product types and discover which categories are thriving. Then use this knowledge to allocate resources wisely, refine your product offerings, and identify potential gaps in your product range which will allow you to diversify and expand strategically.
With reports dedicated specifically to product types, Datma can answer a multitude of questions you might have in this area, such as:
How Is Revenue Shifting Across Product Types?
Knowing how revenue shifts across product types allows you to allocate resources more effectively, by focusing on the high-performing product types that contribute to your growth.
It also helps to improve your marketing. By tailoring your promotional campaigns and advertising to highlight the product types that resonate most with your audience, you can increase the likelihood of attracting and retaining customers.
In order to understand such trends, Datma provides a dedicated report that tracks revenue shifts on a daily, weekly or monthly basis both in value amount and percentage.
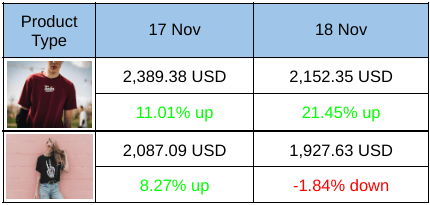
This analysis helps you to adapt to short-term fluctuations and to optimize inventory. It allows you to stay agile and strategically navigate the dynamic ecommerce industry.
Are you interested in more than just revenue trends? Then you’re in luck because this report offers similar analysis for items sold, transactions, refunds, and Cost of Goods Sold (COGS).
What Product Types Catch the Eye of My Customers?
Identifying your popular items will help you adjust your product offerings to meet demand and optimize inventory management.
It will also improve your marketing. By focusing on promoting these popular items, you can create higher engagement and conversion rates.
To find such mentioned product types, you can use the measures included in the below report.
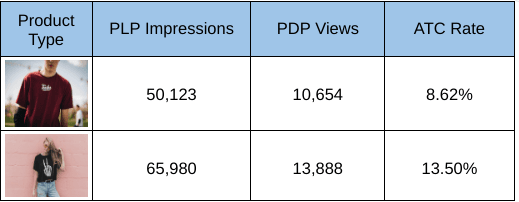
- PLP Impressions (Product Listing Page) tell how frequently a product type appears on listings, providing details into its visual appeal and customer visibility.
- PDP Views (Product Detailed Page) measure the frequency of customers viewing the detailed page of a specific product type.
- ATC Rate (Add to Cart Rate) reflects the ratio of customers adding a specific product type to their cart, offering insights into its potential to convert.
Together, the above measures highlight the product types with a strong market presence that your customers are keen on purchasing.
Are My Product Variants Performing Well?
Product variants are the building blocks of a versatile and customer-centric product catalog. Monitoring and analyzing their performance allows you to refine your offerings to meet diverse customer preferences.
Datma's reporting capabilities enable you to dive deep into metrics like conversion rates, revenue per session, and product views specific to each variant.
This granular level of insight empowers you to optimize pricing, stock levels, and marketing strategies for individual product variations. By aligning your offerings with customer demand, you can enhance customer satisfaction and drive higher conversions.
Using Datma’s analytics means you can answer a question like:
Which Variants Outsell All the Others?
By checking the refunded units, revenue and units sold within the variants report, you can track effortlessly which variant outshines all others.
Scenario: An apparel retailer offers a variety of t-shirts in different colors, styles, and sizes.
Product Variants Report Insight: The report reveals that black, slim-fit t-shirts in medium and large sizes consistently outsell other variants.
Actionable Takeaway: The retailer can focus marketing efforts on promoting these popular variants, ensure they are well-stocked, and consider expanding the range of similar variants.